statfit@geerms.com
1-860-927-8000


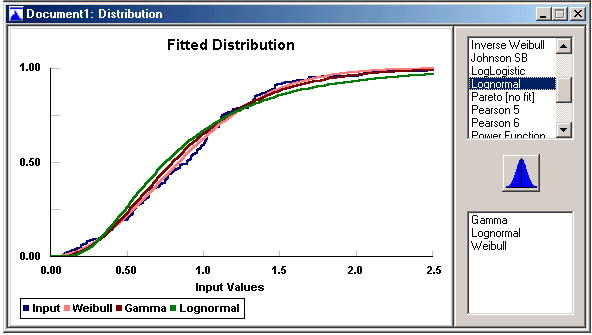
Fit/Results Graphs/Distribution


The Distribution graph can be accessed from the Result Graphs sub menu of the Fit menu.   It is activated only after specific distributions have been chosen.

The Distribution graph, as shown below, is a plot of the input data in the Data Table versus a line drawing of the fitted cumulative distribution(s).   If more than one distribution was fit to the input data, the list at the top right will allow a choice of available plots of fitted distributions.  Clicking a distribution will add that distribution to the plot.  The list at the bottom right contains the cumulative distributions plotted for comparison.  Clicking a distribution in this list will remove that distribution from the plot.  The legend will contain color-coded identification of the plotted distributions and input as shown in the second plot.

This graph, as with all result graphs in Stat::Fit, may be partially modified, saved, copied, or printed with options generally given in the Graph Style , Save As, and Copy commands in the Graphics menu.